Market Failures: Positive and Negative Externalities
Updated 2/17/2022 Jacob Reed
“Externalities” is a term my students often see in some of their early unit tests where they call me over to help them decipher what a question is asking. “Mr. Reed?” the student asks. “What is an externality?”

“What does the question say about them?” I respond.
“It says there are none.”
“That’s all I’ve taught you so far. As far as you know, they don’t exist. We will learn they exist later.”
They most certainly do exist and they are a prime example of market failures.
Read everything below to learn or relearn the basics of positive and negative externalities. When you are done, head to the “Shading Practice” or “Prices, Points, and Quantities” page to get some practice with this. Both of those review games have a few questions on this topic.
What are externalities?
An externality is a cost or benefit to someone other than the producer or consumer. Negative externalities are costs and positive externalities are benefits. Some examples of negative externalities include: second hand smoke (from cigarettes), air pollution (from gasoline), and noise pollution (from concerts). These are all costs that fall on people other than the producer and consumer of that product. Some examples of positive externalities include: nice smell (from a neighborhood cookie factory), herd immunity (from immunizations), and fruit and vegetable production (from bees in the production of honey).
A market without externalities
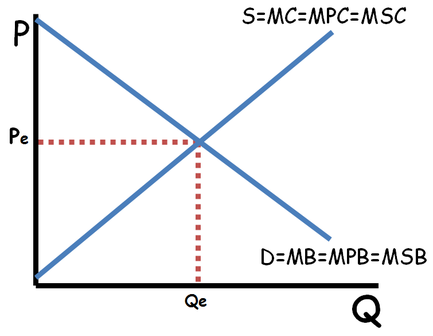
In a market without any externalities the benefits of a product are received by consumers so the demand curve is equal to the marginal benefit (MB) of the product. In this case, since there is no externality, the marginal benefit to consumers (called the marginal private benefit or MPB) is equal to the marginal benefit to society as a whole (called the marginal social benefit or MSB). So the MB, MPB, MSB, and Demand are all equal when there are no externalities.
All of the costs of a product, when there are no externalities, fall on the producers so the supply curve is equal to the marginal cost (MC) of the product. In this case, since there is no externality, the marginal cost to producers (called the marginal private cost or MPC) is equal to the marginal cost to society as a whole (called the marginal social cost or MSC) so the MC, MPC, MSC, and Supply are all equal when there are no externalities.
There are two sources of externalities, externalities in production and externalities in consumption. Externalities in production are external costs or benefits created by the suppliers of a product. When a factory pollutes the environment, the pollution is a negative externality in production. When bees owned by honey producer pollinate a nearby orchard, the fruit that comes from the pollination is a positive externality in production. Externalities in consumption, on the other hand, are external costs or benefits created by the consumers of a product. Secondhand smoke is a negative externality in consumption from cigarette smokers, while herd immunity is a positive externality in consumption for vaccines.
A market with negative externalities
Negative Externalities in Production:
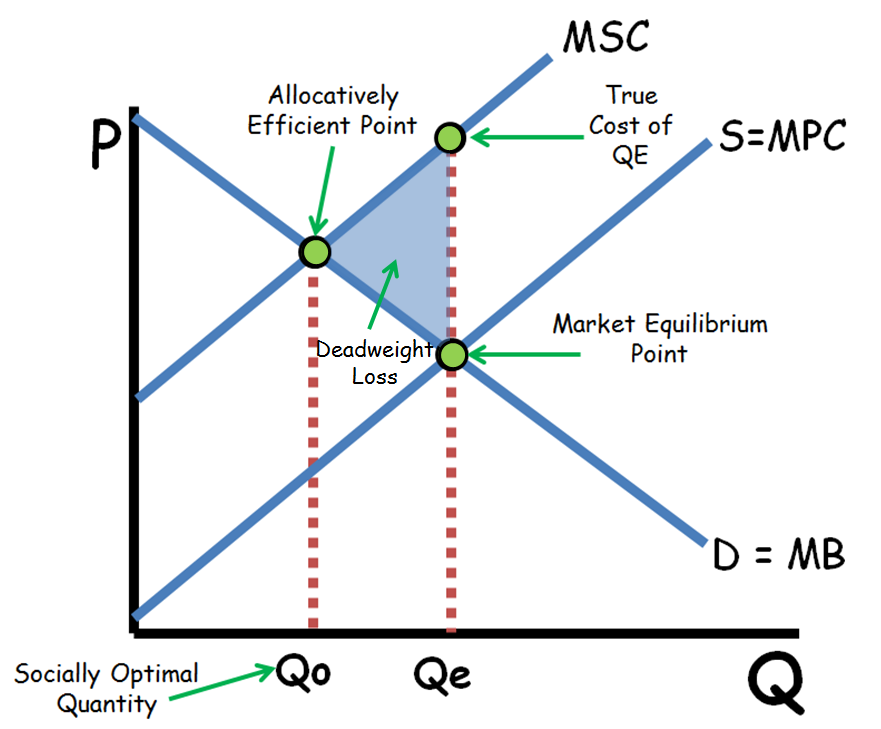
In a market with negative externalities in production, the external cost to society must be added to the marginal private cost to get the marginal social cost. As a result, the MSC is higher than the MPC and Supply. The allocatively efficient quantity (what is best for society) is where the Marginal Social Cost equals the Marginal Social Benefit (MSB=MSC). Unfortunately, the unregulated market will produce the quantity where MPC=MPB. Since the market is not allocatively efficient, there is deadweight loss. The deadweight loss is found by making a point at the allocatively efficient point, then finding the true cost and benefit of the unregulated market quantity. Those three points form a triangle of deadweight loss. If you wanted to calculate the deadweight loss, find the area of the triangle using the price and quantity axes (1/2 base x height). Goods with negative externalities in production cause a market failure because they are generally overproduced and create deadweight loss.
Note: if not otherwise specified, you can assume negative externalities are negative externalities in production.
Negative Externalities in Consumption
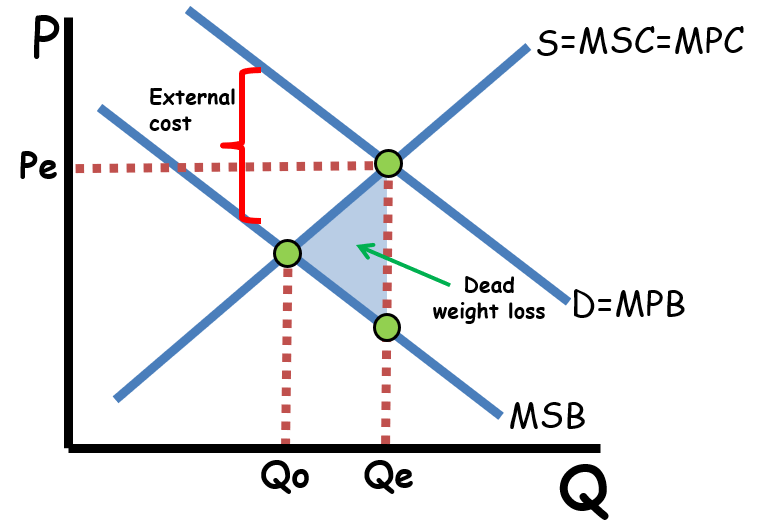
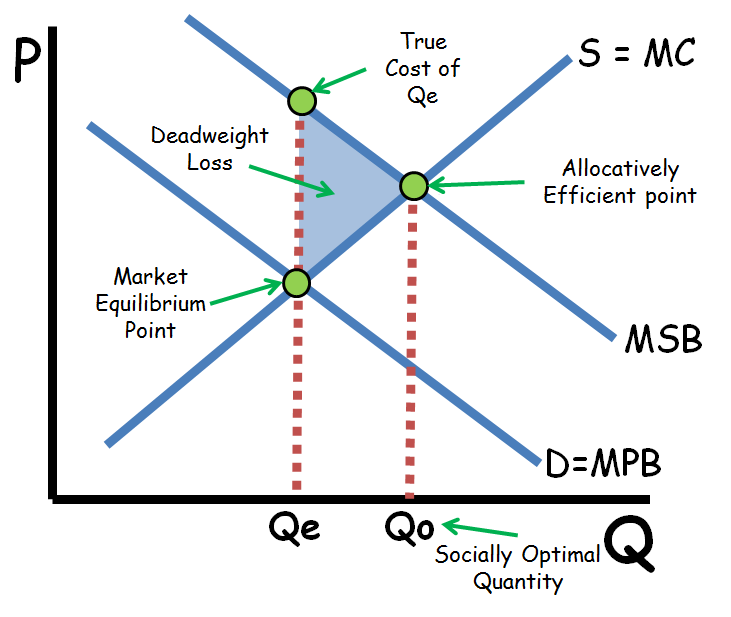
When a good produces a negative externality in consumption, that spill over cost will be subtracted from the marginal private benefit curve to create a lower marginal social benefit curve (or net marginal social benefit). The unregulated market will produce where supply equals demand (Qe below). The allocatively efficient quantity is found where MSC=MSB (Qo below). Since the market is over producing, there is a triangle of dead weight loss that points to the allocatively efficient, or socially optimal, quantity.
Correcting for a negative externality
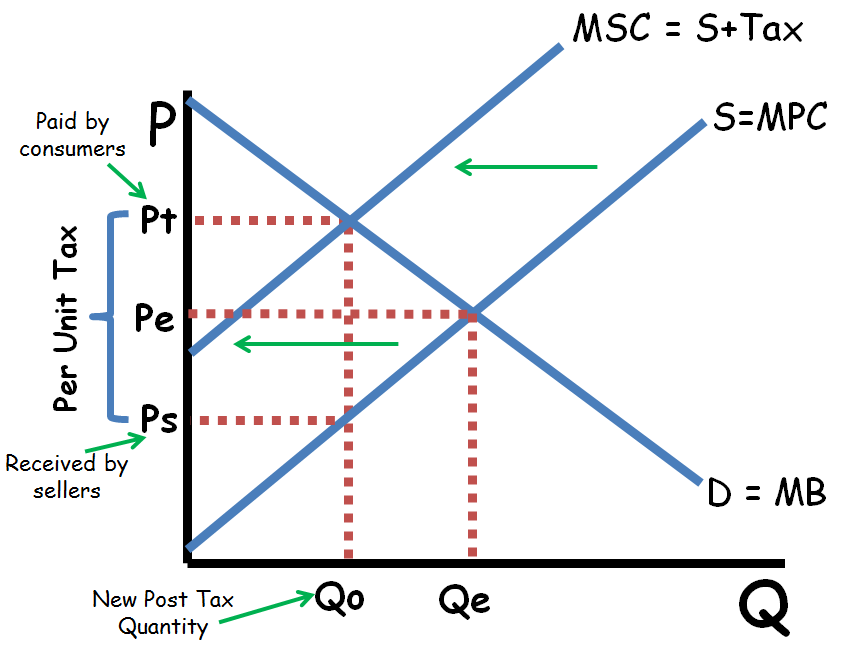
If the government were to impose a per-unit tax (not lump-sum) equal to the external cost of the product, it would shift the supply curve to the left until it equals the MSC curve. The tax would correct for the market failure and the market would now produce the allocatively efficient quantity. So if there is a negative externality, a per-unit tax will reduce deadweight loss.
Note: If the government granted a per-unit subsidy, it would increase quantity, increase deadweight loss, and be less efficient.
A market with positive externalities
Positive Externality in Consumption
In a market with positive externalities in consumption, the external benefit to society must be added to the marginal private benefit to get the marginal social benefit. As a result, the MSB is higher than the MPB and Demand. The allocatively efficient quantity (what is best for society) is where the Marginal Social Benefit equals the Marginal Social Cost (MSB=MSC). Unfortunately, the unregulated market will produce the quantity where MPC=MPB. Since the market is not allocatively efficient, there is deadweight loss. The deadweight loss is found by making a point at the allocatively efficient point, then finding the true cost and benefit of the unregulated market quantity. Those three points form a triangle of deadweight loss. If you wanted to calculate the deadweight loss, find the area of the triangle using the price and quantity axes (1/2 base x height). Goods with positive externalities cause a market failure because they are under produced and create deadweight loss.
Note: if not otherwise specified, you can assume positive externalities are positive externalities in consumption.
Positive Externality in Production
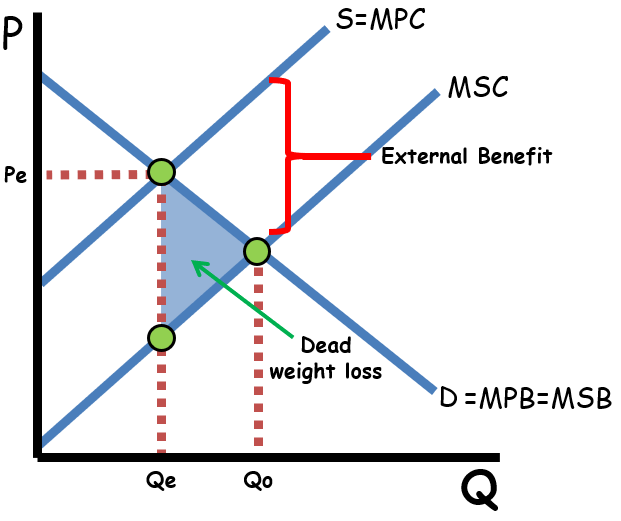
When a good produces a positive externality in production, that spill over benefit will be subtracted from the marginal private cost curve to create a lower marginal social cost curve (or net marginal social cost). The unregulated market will produce where supply equals demand (Qe below). The allocatively efficient quantity is found where MSC=MSB (Qo below). Since the market is under producing, there is a triangle of dead weight loss that points to the allocatively efficient, or socially optimal, quantity.
Correcting for a positive externality
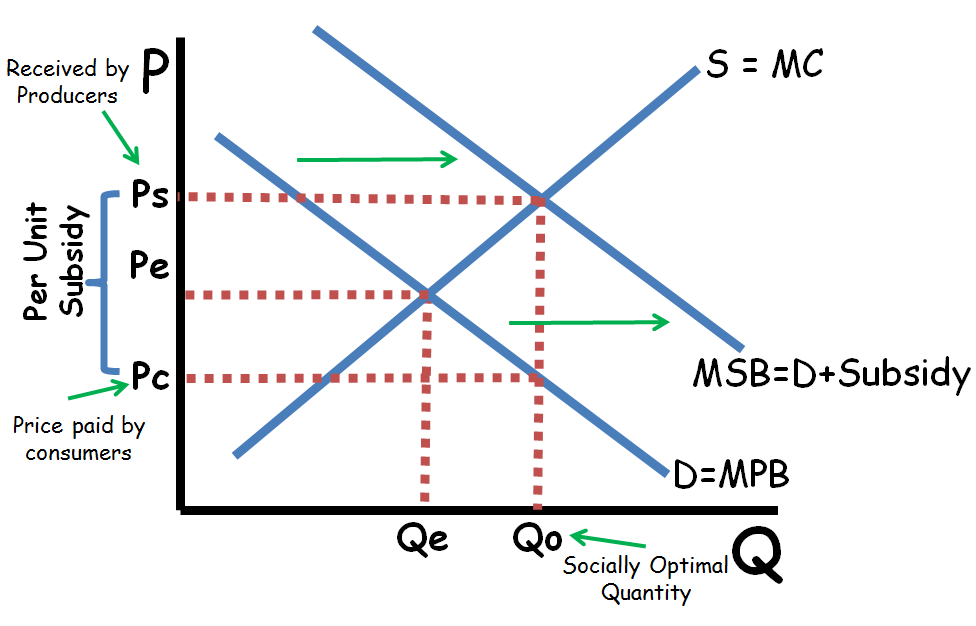
When it comes to correcting for a positive externality market failure, there are two common ways to do it; a per-unit (not lump sum) subsidy to the consumer, or a per-unit subsidy to the producer. A per-unit subsidy to the consumer has the effect of shifting the demand curve to the right. If the subsidy is equal to the external benefit, the demand curve will shift right until it equals the MSB curve.
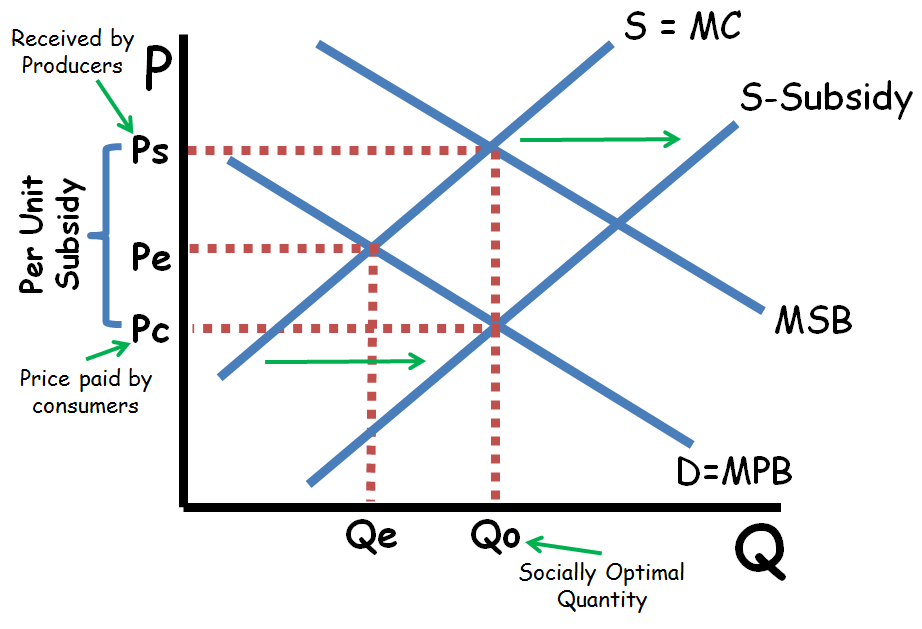
A per-unit subsidy to the producer has the effect of shifting the supply curve to the right. If the subsidy is equal to the external benefit, the supply curve will shift right until it intersects the demand curve at the allocatively efficient quantity.
Either way, a subsidy would correct for the market failure and the market would now produce the allocatively efficient quantity. So if there is a positive externality, a per-unit subsidy will reduce deadweight loss.
Note: If the government imposed a per-unit tax, it would decrease quantity, increase deadweight loss, and be less efficient.
Multiple Choice Connections:
2012 Released AP Microeconomics Exam Questions: 14, 29, 59, 60
Up Next:
Review Game: Shading Practice and Prices, Points, and Quantities
Graph Drawing Practice: Factor Markets and Market Failures
Content Review Page: Income and Wealth Distribution
Other recommended resources: No Bull Economics (Positive Externalities), ACDC Leadership (Negative Externalities)
