3 Keys to Understanding Income and Wealth distribution
Updated 9/30/2021 Jacob Reed
One of the common market failures of modern capitalist economies (as some economists see it) is highly unequal distributions of income and wealth. Some economists argue extremely unequal distributions of income or wealth can lead to political instability and slow economic growth; as resources that would otherwise be used to create wealth are instead used to protect wealth.
*Note: All of the examples below deal with income distribution. Many of these examples also apply to wealth distribution; but it should be noted that countries tend to be more unequal when it comes to wealth distributions than income distribution.0

1. What is the Lorenz Curve?
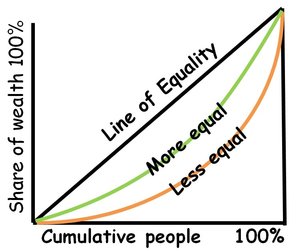
The Lorenz curve is one way to measure income distribution. This curve is a graph with cumulative percentages of income on the Y axis and cumulative percentages of households on the X axis. If each group earns their share of the national income (bottom 20% earn 20% of national income, bottom 60% earn 60%, etc.), the Lorenz curve will be a straight line at a 45° angle. This is called the line of equality. An economy with an unequal distribution of income (bottom 20% earn 2% of national income, bottom 60% earn 15%, etc.), will create a Lorenz curve that is bowed out from the line of equality. Economies with a Lorenz curve farther from the line of equality have a less equal distribution of income and economies with a Lorenz curve closer to the line of equality have a more equal distribution of income.

2. What is the Gini ratio?
The Gini ratio (sometimes called Gini coefficient or Gini Index) is a numerical value derived from the Lorenz curve to measure income distribution. Using the areas from the Lorenz curve graph, the formula for the Gini ratio is:
Gini Ratio = A/(A+B)

3. How do taxes and transfer payments change the Lorenz Curve and Gini ratio?
There are 3 different types of taxes: progressive, regressive, and proportional. Each is based on the percentage of a person’s income.
Progressive Taxes: are taxes where marginal tax rates increase as a person makes more income. A progressive tax system may charge a citizen 10% on the first $10,000 of income, 20% on the next $30,000 ($10,001 – $40,000) and 30% on marginal income above $40,000. That would mean a person earning $5,000 a year would pay $500 in taxes while a person earning $100,000 a year would pay $25,000 in taxes. Progressive income taxes shift the Lorenz curve inward toward the line of equality and lower the Gini ratio.
Regressive Taxes: are taxes where tax rates are higher for those earning less. If a person earning $10,000 pays 10% of their income ($1000) to the regressive tax, a person earning $1,000,000 might pay 5% of their income ($50,000). The higher income earner might pay a higher amount, but the person with less income pays a higher percentage. Sales taxes are considered regressive because low income earners pay higher percentages of their income toward those taxes than high income earners. Regressive taxes shift the Lorenz curve outward away from the line of equality and increase the Gini ratio.
Proportional Taxes: are taxes where the marginal tax rate does not change based on income earned. If someone earning $10,000 pays 10% of their income, then someone earning $1,000,000 would also pay 10% of their income. Proportional taxes do not change the Lorenz curve or Gini ratio.
Transfer Payments: are social programs for people with low income that provide subsidies or direct aid. Social security payments, unemployment compensation, food stamp programs, etc. are all examples of transfer payments. Transfer payments reduce income inequality and shift the Lorenz curve inward toward the line of equality and reduce the Gini ratio.
Multiple Choice Connections:
2012 Released AP Microeconomics Exam Questions: 15, 45, 55
Up Next:
Content Review Page: Rival vs Non-rival and Excludable vs Non-excludable
Other recommended resource: EconPlusDal
