Important Points, Prices, and Quantities on Micro Graphs
Updated 12/20/2016 Jacob Reed
Microeconomics graphs can be tricky. They are all variations of Supply and Demand and the axes of price and quantity are found on every graph. Analyzing those graphs, however, is where many students find some difficulty. Make sure you review these key points, prices, and quantities before you attack that AP Microeconomics exam in May. When you are done, head to the flash review game with a whopping 65 questions to help test your knowledge on all the AP Microeconomics graphs’ important Points, Prices, and Quantities.

Quantity: In a competitive market without government intervention, the price is found at equilibrium (where Supply and Demand intersect). If there is market intervention, the impact on quantity (or quantities) is determined by points along the supply and demand curves. Remember, changes in price cause movement along the supply and demand curves. An increase in price will cause movement up both curves; increasing the quantity supplied and decreasing the quantity demanded (creating a surplus). A decrease in price will cause movement down both curves; decreasing the quantity supplied and increasing quantity demanded (creating a shortage)
Perhaps the most important point on the entire microeconomics exam is the profit maximizing output for the firm. On a product market firm graph, this is where Marginal Cost (MC) equals Marginal Revenue (MR). The Profit Maximizing point corresponds to the profit maximizing quantity on the X axis below. MR=MC is a reoccurring theme on the Microeconomics exam so make sure you memorize that!
In the resource market the quantity of workers hired is found below the point where MRC=MRP. This is true for both perfect competitive resource markets as well as a Monopsony (non-competitive resource market).
Prices: In a competitive market without government intervention, finding the price is as simple as finding the equilibrium point the going out to the Y axis. If there is government intervention it can be a little trickier. Effective, or binding price floors (above equilibrium) and price ceilings (below equilibrium) prevent prices from reaching equilibrium so they are stuck where the price control is placed. Note, non-binding price ceilings (price floor below equilibrium or price ceiling above equilibrium) have no effect on the market and so it reaches equilibrium.
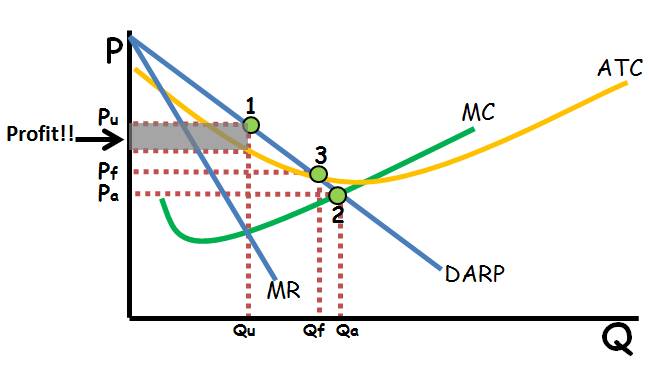
On firm graphs, the price charged differs based on the type of market. Perfectly competitive firms are price takers, so the price is determined by the market (and becomes MRDARP for the firm in the product market and MRC=S in the resource market). Monopolies and Monopolistically Competitive firms get their price by finding the profit maximizing quantity (where MR=MC) then going all the way up to the demand (DARP) curve. In a Monopsony, the wage (price of labor) is located by finding the MRC=MRP point, then going down to the supply curve and across to the Y axis.
Sometimes the government regulates monopoly prices. Essentially these are price ceilings and they show up on the AP Microeconomics exam occasionally. A Socially Optimal Price is a price where the monopoly reaches allocative efficiency (DARP=MC). Since a price ceiling that low would cause some monopolies to incur an economic loss, a Fair Return Price is a viable alternative. The Fair Return Price is found where price equals Average Total Cost (DARP=ATC). At this price the monopoly makes a normal profit.
Allocative Efficiency: Allocative efficiency is getting the right mix of goods and services that is best for society. For individual goods, allocative efficiency is where the Marginal Cost of the good equals the Marginal Benefit of the good. To find allocative efficiency in a competitive market, look for the point where the Marginal Social Benefit (MSB) equals the Marginal Social Cost (MSC). If there are no externalities, this is where the Supply and Demand intersect. On a firm graph, allocative efficiency is where the Marginal Cost (MC) equals Price (DARP).
Productive Efficiency: Productive efficiency means least average cost. You will find this point on any of the Firm Graphs (perfect competition, monopolistic competition, and monopoly) at the minimum point of the Average Total Cost Curve (ATC) where it intersects the Marginal Cost Curve.
Other notes on points, prices, and quantities: The review above doesn’t cover every scenario you might see on the AP Microeconomics exam (or every scenario in the review activity below). When you inevitably run into something you’ve never seen before, remember what the curves on the graphs represent. Each point along every curve corresponds to a price (or cost, or wage) for a specific quantity. Understanding the relationship between the curves will allow you to work through those tougher questions.
Up Next:
Review Game: Micro Graphs’ Important Points, Prices, and Quantities flash review game
Content Review Page: Micro Graphs Shading
Other recommended resources: Crash Course Economics (Price Controls), Economics Fun (Price Controls), No Bull Economics (Excise Taxes,) Economics Fun (Tariffs), No Bull Economics (Perfect Competition), ACDC Leadership (Monopolistic Competition), Jason Welker (Oligopoly), ACDC Leadership (Monopoly), No Bull Economics (Positive Externalities), ACDC Leadership (Negative Externalities)
